CRM reports
Pipeline value, wins and losses, forecast and sources for a period.
Open Overview and choose the period with the date box at the top (it starts on this month). Click a figure at the top to open the deals it counts.
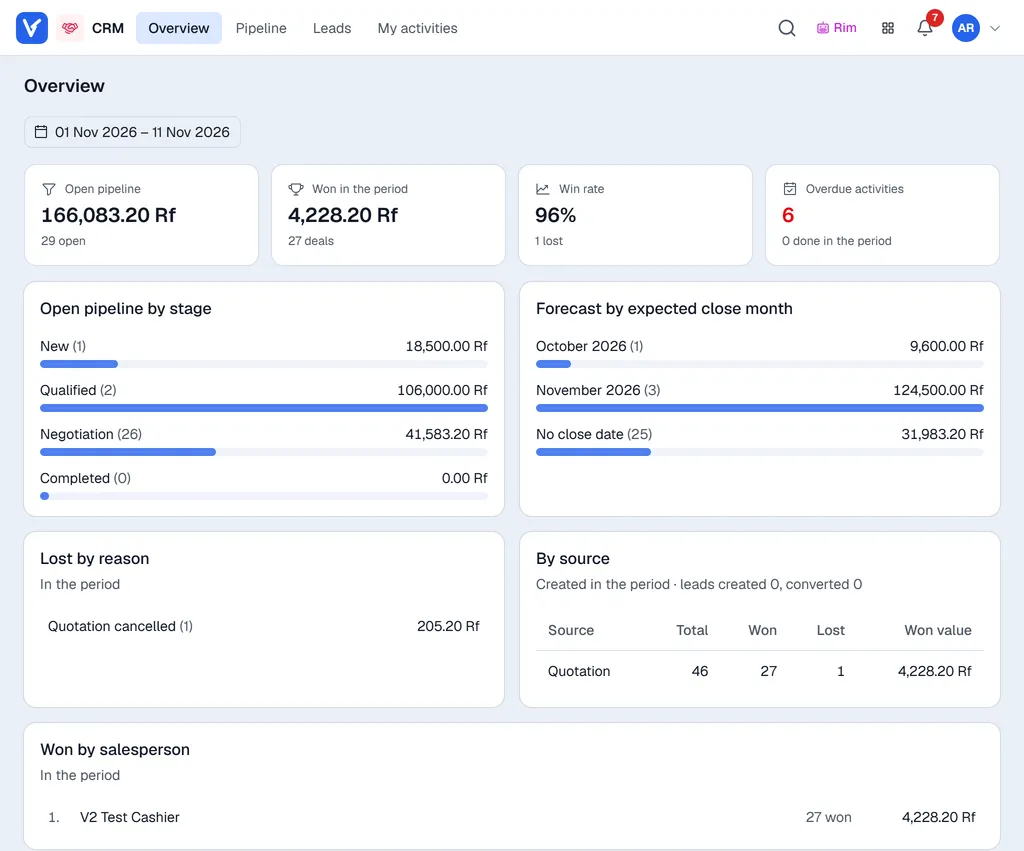
| Part | What it shows |
|---|---|
| Open pipeline | Value and number of all open deals today (not limited to the period). |
| Won in the period | Value and number of deals won in the period. |
| Win rate | Deals won out of deals won plus lost in the period. |
| Overdue activities | Planned activities past their date, and how many were done in the period. |
| Open pipeline by stage | Value and count per stage. |
| Forecast by expected close month | Open deals by the month they should close. Deals without a date are under No close date. |
| Lost by reason | Lost deals grouped by reason. |
| By source | Deals created in the period by source, how many were won and lost, and the number of leads created and converted. |
| Won by salesperson | Shown to users who see the whole pipeline. |
If you only see your own deals, the report says Showing your own records only.
Note. Amounts are added up as they are entered, without converting currencies.