Run and export a report
Open a saved report, choose its parameters, switch between table, pivot and chart, and download it as Excel, CSV or PDF.
Open a report
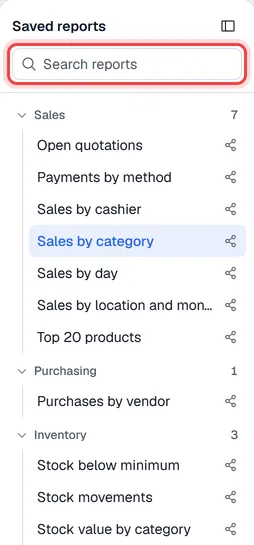
- 1Open Reports from your home page.
- 2Open a folder on the left and click a report. It runs straight away.
- 3To find a report quickly, type part of its name in Search reports.
Reports with the share mark (three linked dots) are visible to everyone in the company.
Choose the parameters
Many reports ask for something before they run, most often a Period.

- 1Pick a period such as This month, Last month, This year or Last 30 days. Custom dates… adds a date box: click it and pick the first and the last day (or one of the quick choices on its left).
- 2Fill in any other choices the report asks for.
- 3Click Apply.
Voltix remembers the last values you used on your own reports, so they open the same way next time.
Table, pivot and chart
Above the result you can switch between Table, Pivot and Chart (Pivot and Chart appear only when the report has one). The number of rows and the time the figures were taken ("as of") are shown next to them. Totals are shown at the bottom of the table.
Large reports
The screen shows at most 1,000 rows. When a report has more, a notice says so. Totals still cover all rows. Download the Excel file to get the full report.
Download, print and save
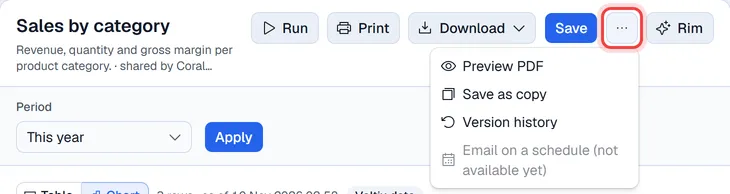
| Button | What it does |
|---|---|
| Run | Runs the report again with the current parameters. |
| Prints a PDF with your company letterhead, the period and the totals. | |
| Download ▾ | PDF (the same PDF as Print), Excel or CSV. Excel and CSV hold the full report; the Excel file also has an About sheet with the parameters used, and a pivot sheet when the report has a pivot. |
| Save | See Save, share and restore reports. |
| … | Preview PDF, Save as copy, Share with the company / Stop sharing, Version history, Email on a schedule and Delete report (owner only). |